Lump sum investing versus dollar cost averaging

Is it better to invest a larger amount of money into the stock market in one go or to split it into smaller investments over a period of time.
This post runs the numbers over 26 years worth of stock market activity to determine the optimal investment strategy between lump sum and dollar cost averaging.
Table of contents
Overview
When we invest our money into the stock market, we can either put it all in at once or spread it out over a period of time. We refer to these options as investing a lump sum versus dollar cost averaging.
The thinking behind dollar cost averaging is that you're hoping to avoid the dreaded scenario where you invest a huge lump sum of your hard earned money the day before the market crashes. By dollar cost averaging into the market, you're hoping to smooth your returns.
On the other hand, the thinking behind lump sum investing is that time in the market is better than timing the market. What we mean by that is, the market tends to go up more than it goes down therefore you should want your money in the market as long as possible.
Ok, so which option is actually superior? We know the thinking behind each, but which one delivers better returns over time?
Historical stock market performance
To figure out the answer, we're going to use the SPY ETF as our investment vehicle since it's a popular choice to represent the broad market in the US.
In the below image, we have the performance of the SPY (closing prices) from 1993 through to the end of 2019.
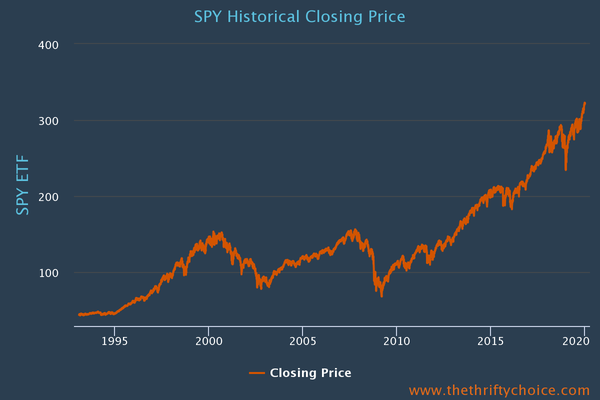
This represents 26 years of sock market behaviour covering varying regimes:
- The tech boom of the 1990's
- The tech crash and bear market of the early 2000's
- The period from 1998 to 2013 where the market traded in a large sideways range
- The 2008 housing crash
- The 2009 to 2020 bull market
Clearly, we've got a wide range of activity to work with. So lets dig in.
Setting the stage - how do we determine a winner?
To determine a winner between lump sum investing and dollar cost averaging, we're going to compare investing $24 000 at the beginning of each year versus $2 000 every month.
To make sure we come away with plenty of useful insights, we're going to run the analysis over multiple time periods to compare how the two strategies perform in differing market regimes (eg: bull, bear, range).
The periods we're going to look at will be:
- 1993 to 2020 (Varying market types)
- 1998 to 2013 (Large sideways range)
- 2000 to 2003 (Bear market)
- 2009 to 2020 (Bull market)
1993 to 2020 (Varying market types)
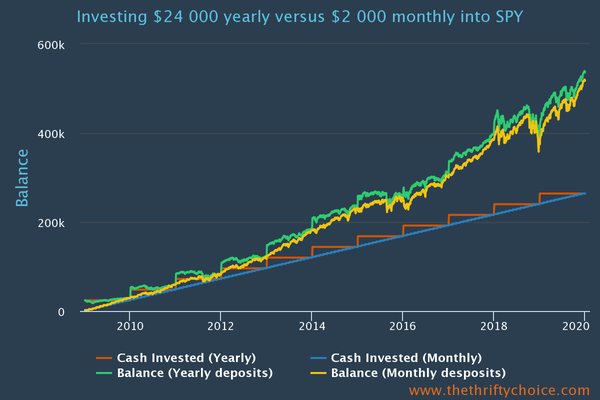
To kick things off, lets look at the entire 26 year period. Remember, we're comparing $24 000 invested at the beginning of each year versus $2 000 every month.
The below chart (and all the ones to follow) contain 4 lines, namely:
- Cash Invested (Yearly) - This is the cumulative total invested over time with the yearly strategy
- Cash Invested (Monthly) - This is the cumulative total invested over time with the monthly strategy
- Balance (Yearly deposits) - This is the investment balance with the yearly strategy
- Balance (Monthly desposits) - This is the investment balance with the monthly strategy
Here's the results:
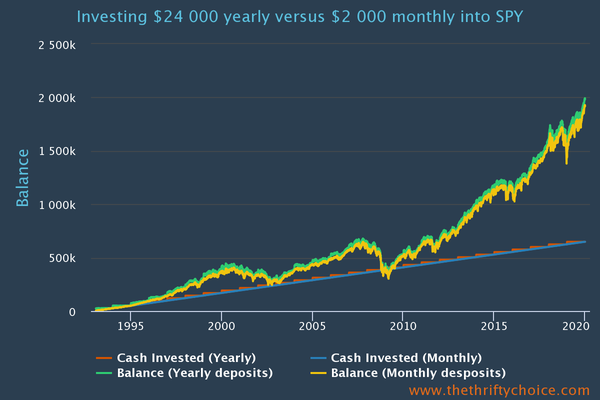
As you can see, the results track each other fairly closely although in the end the lump sum (yearly) strategy tends be the winner most of the time. Here's a look at the final result:
| Final balance | |
|---|---|
| Yearly strategy (lump sum) | $1 985 872.20 |
| Montly strategy (dollar cost average) | $1 921 826.06 |
In the end, the lump sum (yearly) strategy out performed by approximately 3.3%.
This confirms the findings of others who have done similar studies such as this by awealthofcommonsense and this by ofdollarsanddata.
While the specifics and methodologies of other studies may vary, the result tends to indicate that lump sum investing out performs in the region of 2% to 3.5%.
Next, lets dig into some specific time periods to see how these strategies stack up when we're in bull, bear or sideways markets.
1998 to 2013 (Large sideways range)
While the US market moved a lot during these years, it ultimately spent 15 years going sideways. As a side note, this is why it's important to diversify globally and not just rely on the US market.
Let's take a look at our two competing strategies if we started investing in 1998 which would be the start of an ensuing 15 year sideways range.
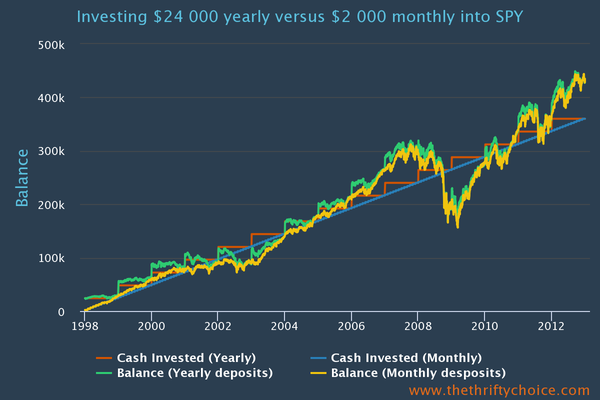
Once again, lets take a look at the final balances:
| Final balance | |
|---|---|
| Yearly strategy (lump sum) | $434 350.50 |
| Montly strategy (dollar cost average) | $434 920.14 |
While the monthly strategy came out ahead, the results are so close that the difference is practically irrelevant.
2000 to 2003 (Bear Market)
Next, we'll take a look at the 3 year bear market from 2000 to the end of 2002.
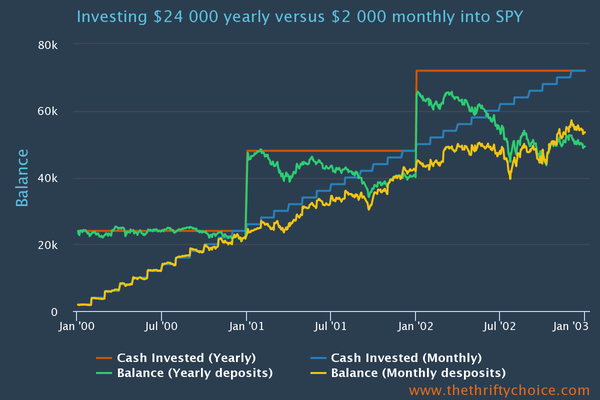
Here we see that during the 3 year bear market, dollar cost averaging outperformed.
| Final balance | |
|---|---|
| Yearly strategy (lump sum) | $49 320.57 |
| Montly strategy (dollar cost average) | $53 555.61 |
Dollar cost averaging came out ahead by approximately 8.5%. That's a sizeable out performance!
2009 to 2020 (Bull market)
Lastly we'll examine the 11 year bull market from the start of 2009 to the end of 2019.
Once again, here are the final balances:
| Final balance | |
|---|---|
| Yearly strategy (lump sum) | $537 506.20 |
| Montly strategy (dollar cost average) | $518 516.46 |
Lump sum investing during the bull market out performed by approximately 3.7%.
During a bull market, you'll want to have your money in the market for as long as possible, which means lump sum investing is the winner here.
The final verdict
So we've determined that:
- Over a long period of time which includes multiple market regimes, lump sum investing wins.
- In sideways markets there is no clear winner.
- In bear markets, dollar cost averaging is the clear winner.
- In bull markets, lump sum investing comes out ahead.
The stock market goes up more than it goes down which means that over a long enough time period, lump sum investing is going to be the winner.
But I invest part of my pay check into the market every month, what now?
For those that invest money into the market every month when you receive your pay check, you might be wondering how to think about the above findings. Well, all this means is that you should be aiming to get your money into the market as soon as possible (ie: as a lump sum).
Don't hang on to your pay check and try to time the market or dollar cost average in. Just bite the bullet and invest as soon as the money hits your account so that you can take advantage of the stock market's long term tendency to go up.
Article by Brendon @ Money FI